What does the 2020 Bitcoin bull run look like on chain?
This is an excerpt from our December Market Update
Each month we dive into on-chain data to explore interesting trends or movements on the Bitcoin network. (Table 2)
Table 2: Bitcoin network activity — November vs October

The record setting November bitcoin price action occurred alongside a strong increase in bitcoin on-chain activity. There was an increase of 1.8% in the number of daily transactions and 3.4% increase in the number of daily payments; daily number of active addresses were also up 8.9%.
This increased activity resulted in the average fees per transaction being higher in November with an average of $6 per transaction, which is still much lower than what was observed during the 2017 bull run where the daily average fee per transaction remained above $20 during more than 30 days.
Last month we were talking about the sudden 25% drop in estimated hash rate towards the end of October. It has now bounced back from 108 EH/s to a solid 129 EH/s on average, thanks to the difficulty adjustment and an increasing bitcoin price attracting additional mining hashing power. (Less efficient mining hardware can again become profitable to operate as the bitcoin price rises.)
Bull run comparison: December 2017 vs November 2020
The mempool is where all the valid transactions wait to be confirmed by the Bitcoin network before being added to the blockchain. A high mempool size indicates more network traffic.
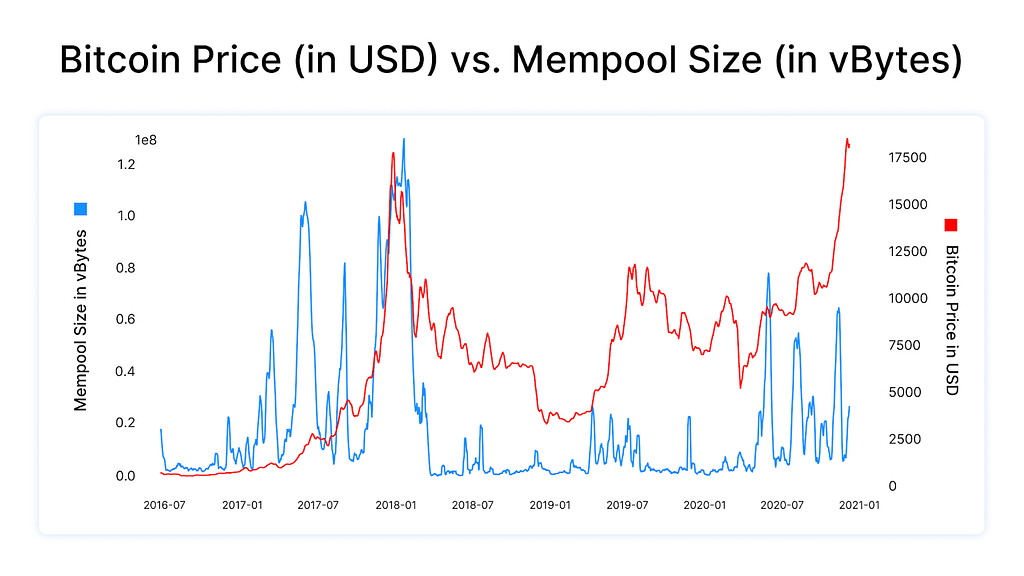
Interestingly, the recent price action saw relatively low levels of mempool activity in comparison to the previous bull run in December 2017 (Figure 2a).
Figure 2a: Mempool size showing lower activity in November 2020 than during the December 2017 bull run
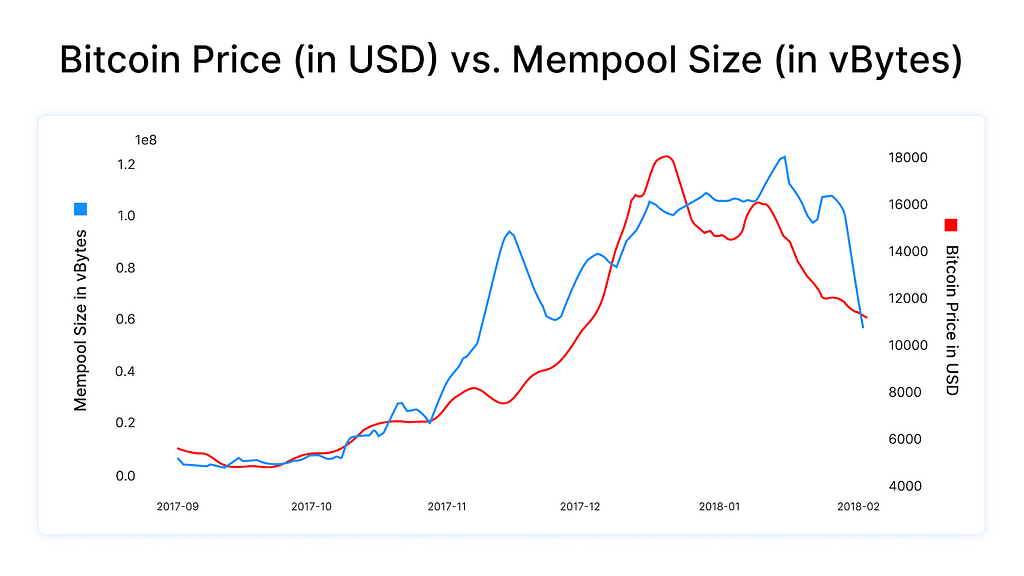
Looking more closely, Figure 2b shows that the mempool size remained high during the 2017 bull run, with a tight correlation between mempool size and price.
Figure 2b: December 2017 bull run saw an uptick in mempool size as the price increase
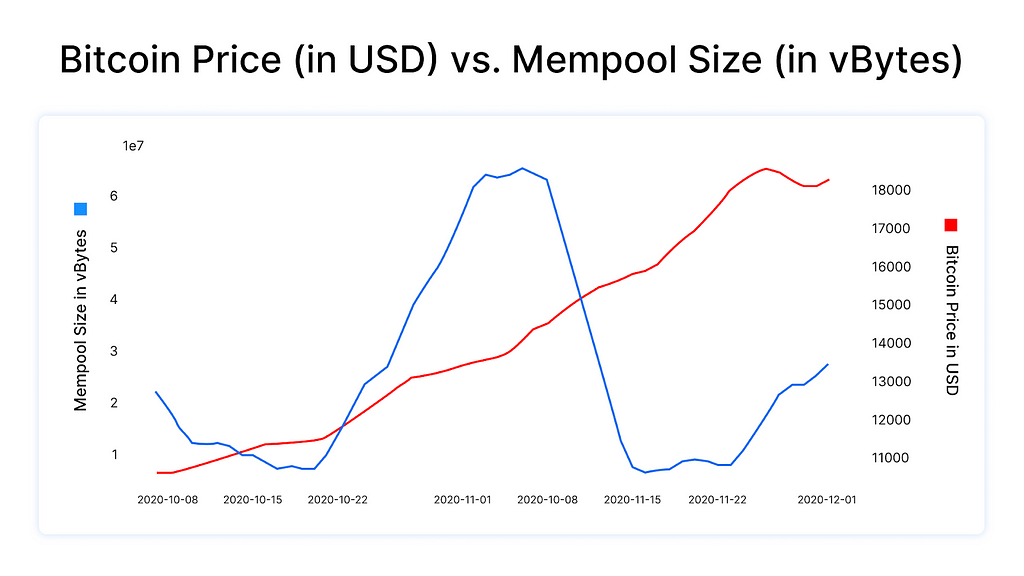
Activity in November 2020 initially shows a similar pattern as 2017, with the mempool size going back to usual levels in the middle of the bull run (Figure 2c). Part of the recent transaction backlog was caused by a decrease in hash rate just before the difficulty adjustment on the 3rd of November, as opposed to an abnormal increase in on-chain transactions.
Figure 2c: Mempool size remained low in November 2020 apart from a short spike mainly due to the decrease in hashrate — not the price
This suggests two possibilities:
- on-chain transactions are more efficiently conducted nowadays with batched transactions and segwit transactions being more widely used (ie withdrawals from exchanges that batch transactions occupy less block space)
- price action is driven more by off-chain exchange and big institutions rather than retail transactions, which perhaps would have a bigger share of transactions settled on-chain
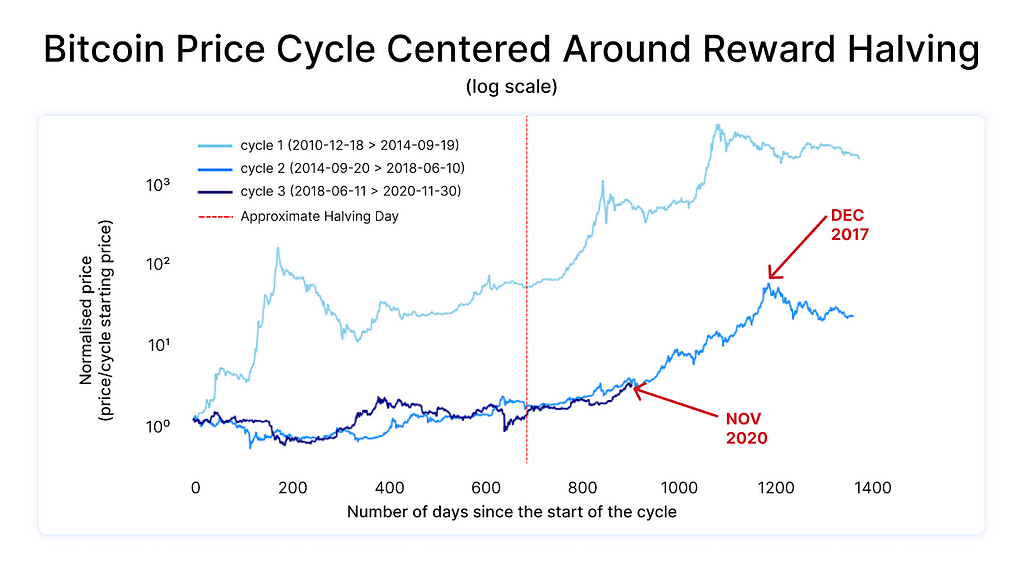
On another note, while the December 2017 rally around the $19k price mark occurred towards the end of the halving cycle, we are currently still relatively early in the cycle (Figure 3).
Figure 3: November 2020 bull run is earlier in the halving cycle than December 2017
On-chain bitcoin ownership concentration measures can be challenging to interpret during significant price swings
One concern that has arisen about bitcoin is ownership concentration. More specifically, the concern is that a relatively small number of people control an outsized share of bitcoin relative to ownership concentrations of other assets. This concern has been cited by the US Securities and Exchange Commission as one of the reasons for their reluctance to approve a bitcoin ETF.
We continue to monitor on-chain metrics to try to gain a sense of how bitcoin ownership concentration is evolving. While on-chain metrics would appear to suggest a slight decrease in the number of individual owners of bitcoin in November, these data can be misleading, particularly during big price swings like we’ve seen recently.
In November we saw a slight decrease from October in the number of individual bitcoin addresses holding both 0.1 and 1 bitcoin:
October 2020
- 3,178,169 addresses (9.59% of total addresses) have more than 0.1 BTC, and represent 98.82 % of total bitcoins
- 822,971 addresses (2.48% of total addresses) have more than 1 BTC, and represent 94.82 % of total bitcoins
November 2020
- 3,115,354 addresses (9.38% of total addresses) have more than 0.1 BTC, and represent 98.85 % of total bitcoins
- 821,358 addresses (2.47% of total addresses) have more than 1 BTC, and represent 94.95 % of total bitcoins
How do these decreases align with reports of significant increases in the number of new owners of cryptoassets during the month of November? Several possibilities exist.
First, it is likely that many new cryptoasset owners are primarily utilizing third-party intermediary exchanges that hold cryptoassets on behalf of individuals, such as PayPal, Square, and the Blockchain.com Exchange. A growth in new users of custodial exchanges would not necessarily show up in on-chain ownership dispersion statistics.
Further, during periods of big price swings coins tend to move more frequently than during “crypto winter” periods. The address count decline could reflect individual owners moving coins to exchanges or consolidating balances.
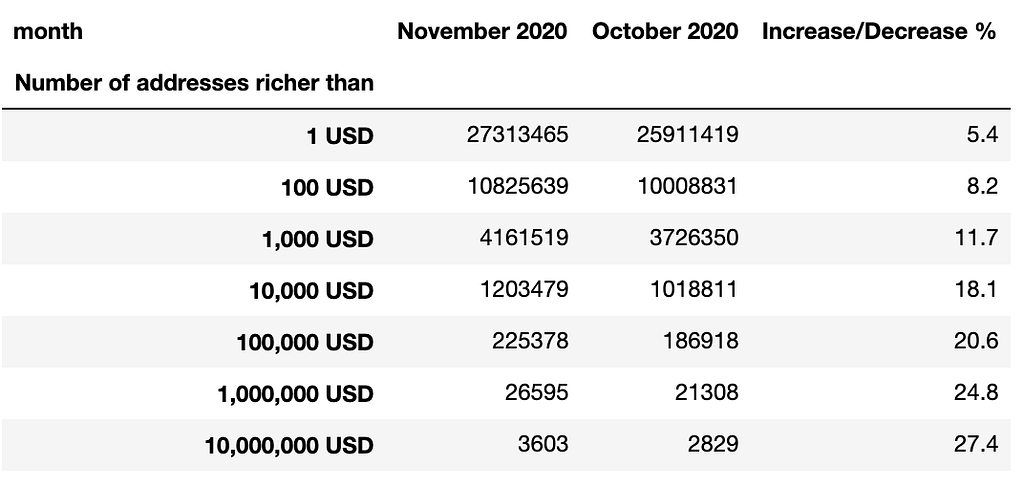
One thing we can say for certain: recent price gains have made all bitcoin holders, regardless of their levels of ownership, better-off financially (Table 3).
Table 3: Bitcoin owner wealth increasing
Source: BitInfoCharts
Footnotes:
- Average daily number of confirmed transactions in the public blockchain
- Average daily number of confirmed transactions sent from our Blockchain Wallet and API
- Average daily number of unique addresses used as inputs and outputs in the confirmed transactions
- Average daily number of estimated payments in the public blockchain
What does the 2020 Bitcoin bull run look like on chain? was originally published in @blockchain on Medium, where people are continuing the conversation by highlighting and responding to this story.


