Trust | Want | Need

March Market Outlook
The Blockchain.com general crypto investment thesis, first published in slide format almost two years ago, highlighted three important elements of crypto adoption:
- Trust: are cryptoassets and protocols like bitcoin (and crypto service providers that support them) trusted enough for a majority of people to use and own?
- Want: do people have a favorable attitude towards holding and using cryptoassets?
- Need: is there sufficient motivation to change behaviors to hold and use cryptoassets?
Prior surveys had identified that crypto was owned by as little as 5% or less of the population in a nation like the United States. This low ownership level was due in part to perceived deficiencies across one or more of these three dimensions.
With bitcoin and cryptoasset values setting another all-time high in February where do we stand today with the trust, want and need for crypto?
The need for crypto is clear, and trust is growing
Of these three adoption dimensions, our view is that bitcoin and crypto have made the strongest progress in the past two years across the “need” dimension.
Concerns over inflation, outsized government debt levels, and financial repression have made crystal clear the case for owning hard assets like bitcoin. In recent months Wall Street and Corporate America have put a clear exclamation point on the need to own crypto.
At the same time, the emergence of DeFi and its double-digit savings rates have created a real alternative to banks that offer effectively zero or negative returns on savings deposits. The GameStop firestorm also illustrated the value of decentralization and trust minimization.
We would also argue that improvements in security practices (and security education), increased regulatory clarity, and further institutionalization of bitcoin have helped improve “trust” in crypto. However, ongoing “rug” pulls or exploits on various DeFi platforms, and a return of 2017-style dubious coin launches, illustrate the need for continued vigilance around some of the bleeding edges of the crypto landscape.
Helping more people “want” to own crypto is arguably the biggest adoption hurdle remaining
The crypto the dimension that lags the furthest for various reasons in our view is “want”, or the desire to own crypto.
Some reasons for a lack of desire to own crypto include:
- ongoing concerns over bitcoin’s energy consumption and carbon footprint
- speculative volatility and hype cycles, which can be stressful for many or result in feelings that “I’m too late” and “missed the bitcoin boat”
- confusion over what’s a reasonable valuation for a cryptoasset, particularly for ones that show little to no bona fide economic activity (“ghost chains”) but see their prices pump anyway
- concerns that crypto is primarily used by the “bad guys” and rogue nations
While drilling down into each of these topics will often alleviate concerns (see here and here), there still remains the good ‘ol fashion human tendency towards inertia and resistance to change.
People are famously creatures of habit and generally don’t want to change.
For these and other reasons, as investors like Lightspeed partner and Blockchain.com board member Jeremy Liew presciently articulated as early as the 2014 San Francisco CoinSummit, bitcoin and crypto adoption has always been a “long game”.
Even though the pace of cryptoasset adoption is outpacing the adoption speed of the internet and PC, the level of disruption posed by bitcoin and blockchain technology is so significant that in order for it to succeed adoption must proceed in a measured way.
In other words, the transformation of our financial system to one powered by blockchain technology is happening right on schedule.
March outlook
We’re now pleased to offer you our latest thoughts on what’s driving crypto markets and analysis of bitcoin on-chain activity this month.
Be sure to also watch and listen to this month’s webinar featuring Ambre Soubiran, CEO of Kaiko, and our discussion of topics like what it’s like to work on the front lines of building a reliable crypto data platform and the current state of crypto trading markets.
Quick take:
- Market Movements
- Bitcoin (BTC) set another new all-time high at ~$58k on the 21st of February, and finished the month up 36%; Ethereum (ETH) lagged but was up 8% for the month
- Broader financial markets were mixed: stocks were up almost 3% but two big losers in February were long-dated US treasuries (-5.8%) and gold (-6.2%)
- We draw medium-term confidence in bitcoin’s valuation outlook based on its valuation relative to gold
2. On-chain insights: Highlights from the Blockchain.com data science team
- Average bitcoin transaction fees nearly double to $21 per transaction. May have resulted in a decrease in retail activity.
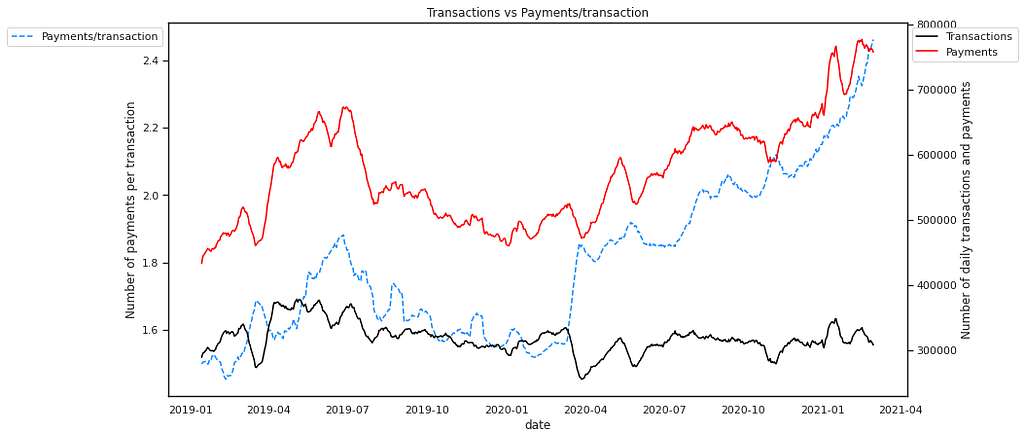
- The bitcoin network continues it’s trend towards efficiency in processing multiple payments within one transaction. This fact is often lost in the energy consumption story held by some media outlets.
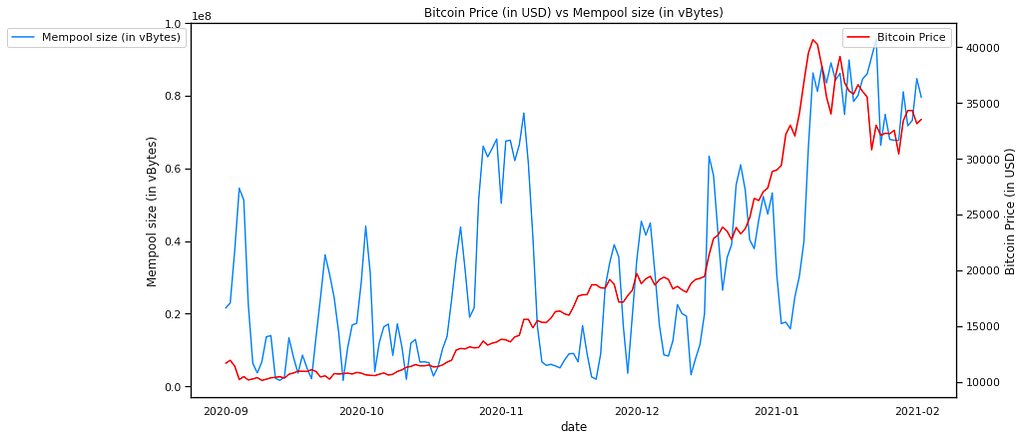
- Mempool size has inflated with the price of bitcoin, causing some payments to get stuck in the mempool. Roughly 25% of transactions have been waiting in the mempool for at least 6 days.
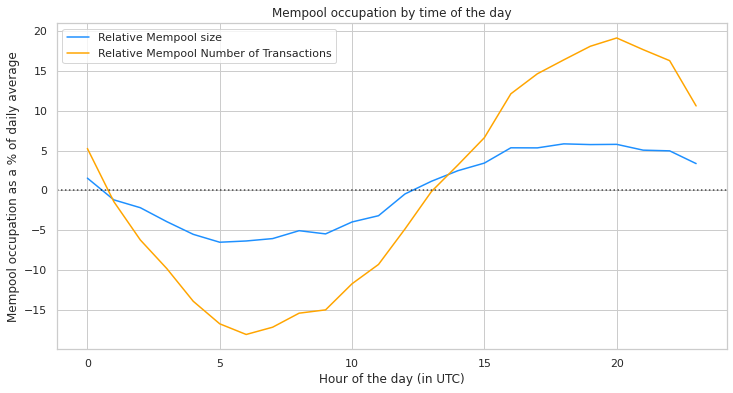
- The mempool acts in a cyclical manner. Mempool levels are at their lowest on Sundays and in the early morning house (UTC).
3. Kaiko’s February Market Report
- Institutional demand for crypto products continues to soar, which is important to sustaining and boosting crypto valuations from current levels
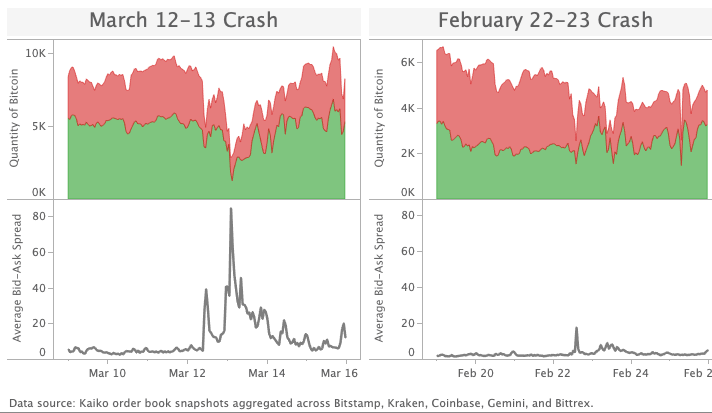
- Crypto markets have become more robust as spreads and depth are less volatile following a crash
- The vulnerability of crypto exchange infrastructure continues to be on display with downtime, lagging interfaces, and a brief flash crash on Kraken
4. What we’re reading and hearing
1. Bitcoin blasts higher while long bonds and gold plunge; US dollar stays steady
The crypto bull market powered on in February with bitcoin (BTC) setting another new all-time high at ~$58k on the 21st of February, and finishing the month up 36%. Ethereum (ETH) lagged bitcoin but still turned in an impressive +8% monthly performance. Both are up around 1,000% over the last two years with Bitcoin back to outperforming Ethereum over that time period.
Asset markets in general were mixed in February, with stocks up (S&P500 +2.6%). The US dollar turned in a second consecutive positive month and was up 0.3% for the month, slightly less than January’s +0.7%.
Two big losers in February were long-dated US treasuries (-5.8%) and gold (-6.2%).
Table 1: Price Comparison: Bitcoin, Ethereum, Gold, US Equities, Long-dated US Treasuries, US Dollar (% Change)

The sharp sell-off in gold may be in part related to a firmer dollar and increase in bond yields, which traditionally draw investors away from the yellow metal. However, we also continue to see evidence of more investors coming around to accept bitcoin as an alternative to gold, albeit one with more functionality and potential upside.
We draw medium-term confidence in bitcoin’s valuation outlook based on the following three market statistics:
- all above-ground gold estimated to be worth approximately $10 trillion
- gold available for investment is estimated to be in the ~$2.5 trillion range
- bitcoin’s total market value is currently less than $1 trillion
And as we watch a very broad range of use cases for crypto continue to blossom, including non-monetary use cases such as the Microsoft digital identity system anchored to bitcoin, we also continue to caution against viewing bitcoin’s market potential as bound by gold’s valuation levels.
2. On-Chain Analysis
February brought another string of bitcoin price and network activity all-time highs, which not surprisingly impacted the cost of using the bitcoin network.
Table 2: February vs January bitcoin network activity

On the surface, with BTC volatility we might expect on-chain activity to increase in response. However, the average daily number of transactions in February decreased.
Two likely causes of this are mempool delays — which we’ll discuss later in the report — and increased fees. The average bitcoin transaction fee nearly doubled in February to $21 per transaction. Spikes in fees disproportionately affect the crypto “retail” market (smaller holders), as institutional investors are likely to weather fee increases more easily as they are typically transacting much larger sums.
Efficiency of bitcoin
As discussed in last month’s Market Outlook, “payments” have become a more accurate metric than “transactions” to measure on-chain economic activity.
In 2020, some crypto entities began batching transactions. This batching allows multiple payments to be completed within a single transaction, setting off a more efficient trend for the bitcoin network. Figure 1 illustrates this continued trend of bitcoin efficiency.
This is an important fact to reiterate, as it’s often lost in the energy consumption conversation seen in media coverage. Media interest in bitcoin’s energy consumption is not a new phenomena. However coverage does not accurately reflect or even discuss at all the increasing efficiency of the bitcoin network from batching implementation.
Figure 1: Bitcoin transactional efficiency continues to increase, a fact often lost in energy consumption media coverage
Congested mempool
As the price of bitcoin rises, the size of the mempool tends to increase with it (see our definition of the mempool and live chart here).
We see that currently, as shown in Figure 2. The inflated mempool size led to increased waiting times for transaction confirmations. Roughly 25% of transactions have been waiting in the mempool for at least 6 days.
Transactions with higher BTC volumes can afford the high fees in these conditions, as miners give priority to transactions paying higher ‘priority’ fees.
Figure 2: Mempool size has inflated with bitcoin’s price; 25% of transactions have been waiting for at least 6 days
In conditions like this when the mempool levels are congested, it’s important to understand the cyclical nature of the mempool.
Mempool levels are at their lowest on Sundays and in the early morning hours (UTC). While there are many contributing factors to a transaction’s confirmation, you’ll have better luck when placing an on-chain transaction during these ‘low peak’ times.
Figure 3: Mempool trend by day of week — bitcoin network “traffic jams” are at their lowest on Sundays
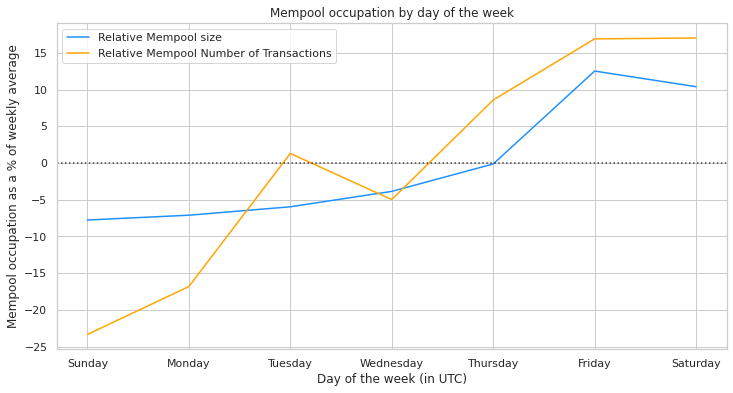
Figure 4: Mempool trend by time of day — bitcoin network “traffic jams” are at their lowest in the early morning London hours (UTC)
3. Kaiko’s February Market Report — Guest Post by Kaiko
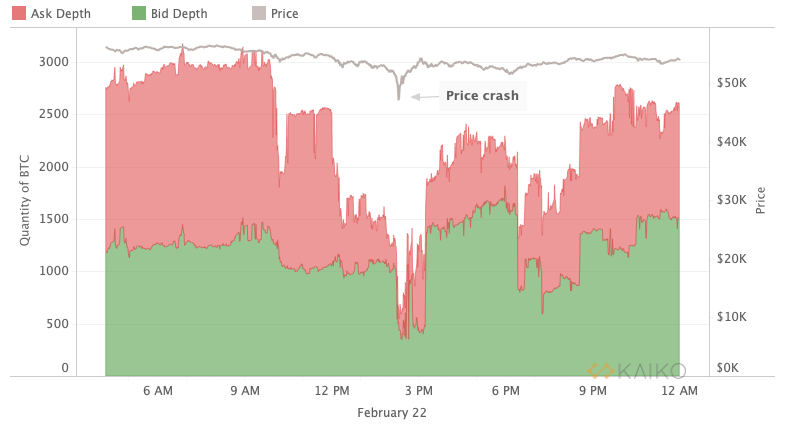
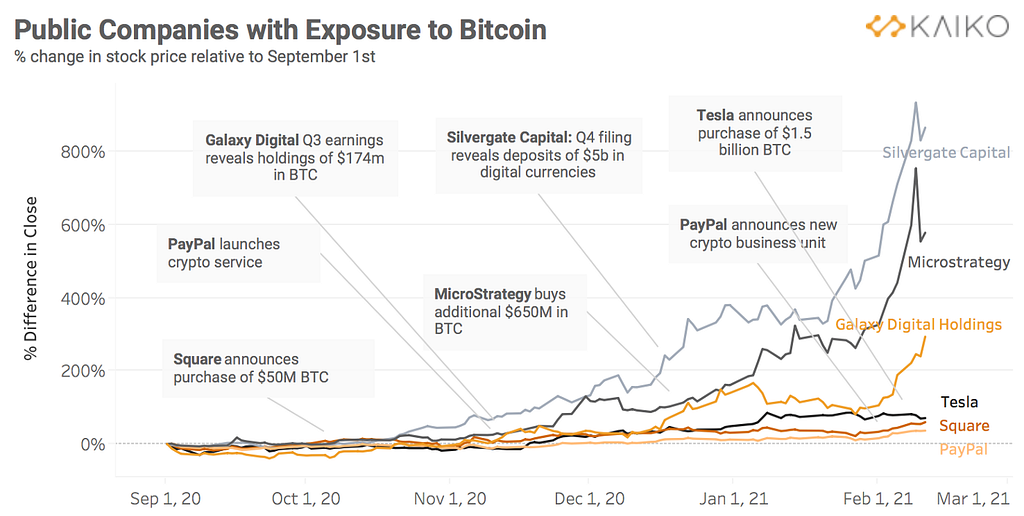
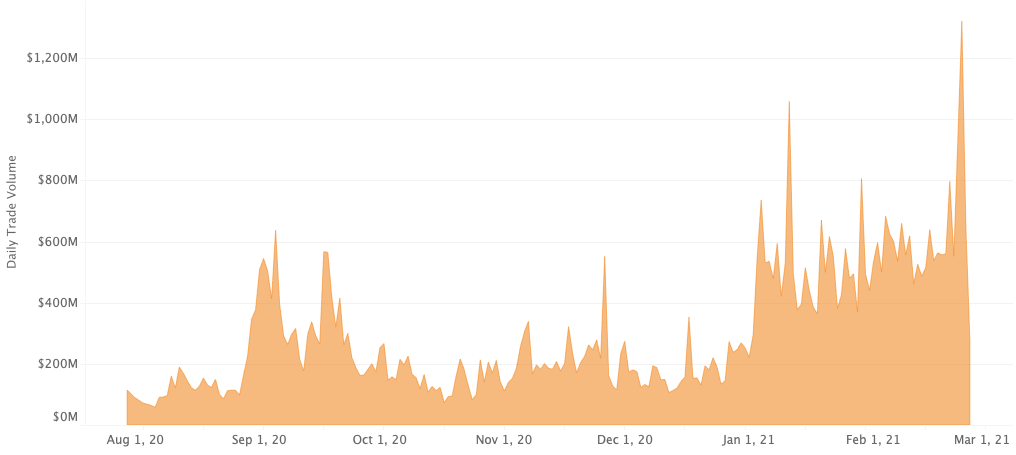
February encapsulated both the promise and pitfalls that exist today in the cryptocurrency industry. Throughout the month, markets reached multiple new all time highs, the first North American Bitcoin ETF started trading, Tesla announced a $1.5 billion BTC purchase, and Coinbase’s S-1 filing revealed surging institutional demand. Yet, the compounding cycle of good news eventually proved unsustainable for prices, resulting in a double-digit crash across crypto markets, which triggered the highest volume of forced liquidations ever recorded.
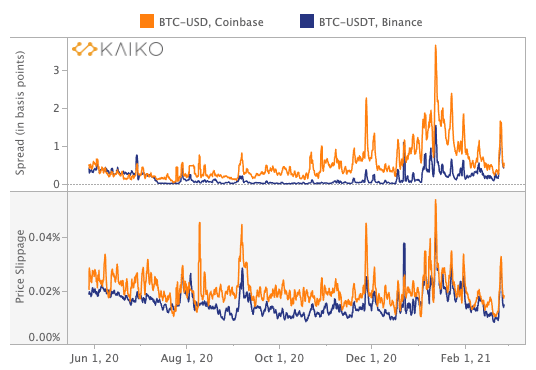
The vulnerability of crypto exchange infrastructure was on display during the market mayhem, with downtime, lagging interfaces, and a brief flash crash on Kraken. While a lot has changed over the past year, markets are still highly-leveraged, which makes the magnitude of price crashes extreme and unpredictable. The good news, though, is that there is increasing evidence that overall market liquidity has improved, with spreads and market depth recovering more quickly following extreme volatility compared with one year ago.
Highlights from the report:
1. The Anatomy of a price change
An exploration of the crash on February 22nd looking at order book liquidity and trade volume.
2. Institutional Demand for Crypto Products Continues to Soar
Ethereum had its CME futures debut, the first North American crypto ETF started trading on the Toronto Stock Exchange, several new crypto trusts began accepting investors, and a range of investment product applications were filed with regulatory agencies.
3. Exchange Competition is Heating Up
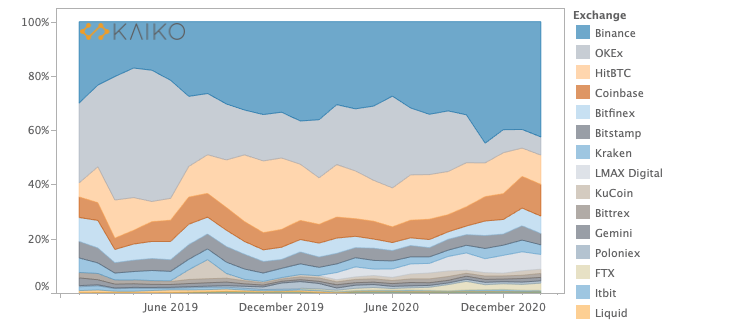
A look at how exchanges differentiate by the pairs they list and market share of volume.
4. Coinbase vs Binance: Liquidity Analysis
Analyzing the two biggest exchange competitors.
5. Exploring Uniswap: The Biggest Decentralized Exchange
DEX volume has soared over the past year.
6. Markets Have Become More Robust
Spreads and depth are less volatile following a crash.
Download the full PDF monthly report here and subscribe to our weekly market analysis here.
4. What we’re reading, hearing and watching.
Crypto
- Allen Farrington: Bitcoin Is Venice
- Andreessen Horowitz (a16z): NFTs and a Thousand True Fans
- Balaji S. Srinivasan: How India Legalizes Crypto
- Balaji S. Srinivasan: Why India Should Buy Bitcoin
- CBS News: There may now be as many as 100,000 bitcoin millionaires
- CoinDesk: China Leads Africa’s Digital Currency Race
- CoinDesk: China’s Central Bank Is Partnering With SWIFT on a New Joint Venture
- CoinDesk: Money Reimagined: Enterprise Blockchain Isn’t Dead
- CoinDesk: What Bloomberg Gets Wrong About Bitcoin’s Climate Footprint
- CoinDesk: Why Crypto Markets Aren’t ‘All-to-All’ Either (and How They Can Be)
- Compass Mining: Hashrate Under Management
- Economic Research, Federal Reserve Bank of St. Louis: Decentralized Finance: On Blockchain — and Smart Contract — Based Financial Markets
- Marginal Revolution: My Conversation with Brian Armstrong
- Official Monetary and Financial Institutions Forum (OMFIF): Diem bridges banking and crypto worlds
- Paxos Blog: What Lehman Brothers, Gamestop and the Next Financial Crisis Have in Common
- The Information: China Is Winning the Digital Currency War With the U.S.
- The Pomp Podcast: #477 Avichal Garg on His Crypto Thesis
- The Wall Street Journal: Bitcoin’s Value Is All in the Eye of the ‘Bithodler’
- The Wall Street Journal: Dogecoin Has a Top Dog Worth $2.1 Billion
- VoxEU: Central bank digital currencies risk becoming a gigantic flop
Beyond Crypto
- Alex Birsan: Dependency Confusion: How I Hacked Into Apple, Microsoft and Dozens of Other Companies
- All-In with Chamath, Jason, Sacks & Friedberg: E20: Robinhood wrap up, Insiders vs Outsiders, California’s failing report card & how to fix it
- New Atlas: Stanford study into “Zoom Fatigue” explains why video chats are so tiring
- Peterson Institute for International Economics (PIIE): Inflation fears and the Biden stimulus: Look to the Korean War, not Vietnam
- Project Syndicate: Can Navalny Take Down Putin?
- Project Syndicate: Why Mars Matters
- ProtonMail: Best WhatsApp alternatives that respect your privacy
- Slashdot: Miami Is Considering Paying Its City Employees In Bitcoin
- Slashdot: Nevada Bill Would Allow Tech Companies to Create Governments
- Tablet: The New Americans
- The Reformed Broker: How David Beats Goliath in Real Life
Trust | Want | Need was originally published in @blockchain on Medium, where people are continuing the conversation by highlighting and responding to this story.


