May Market Outlook

Sell in May and Go Away?
Last month we published our first monthly market outlook with insights, analysis and perspectives on crypto and the broader financial markets. We received a very positive response to the April Outlook and as we head into May we’re pleased to offer you our latest thoughts on a variety of topics, including the overall stock market’s performance and what it means for crypto, why Ethereum’s price is outperforming Bitcoin’s and whether that will continue, and (of course) what impact we expect from the bitcoin mining reward “halving” anticipated on 12 May.
Summary
1. Market movements: BTC is outperforming gold, but Bonds are outperforming BTC
- Crypto continued its rebound from its mid-March lows and at end of April bitcoin was up 22% for 2020
- Bitcoin has also outperformed other assets that have generated a positive return for 2020 (eg gold +6%), but is underperforming long-dated US Treasuries (eg TLT ETF + 23%) and a few cryptoassets
- Price of ETH has outperformed BTC both in April (57%) and YTD (64%)
- Ethereum (ETH) has shown positive fundamentals in 2020 with rising ERC-20-based stablecoin use and progress towards Ethereum 2.0 rollout
- Overall, holding ETH is probably riskier than holding BTC, but as the various forms of wrapped BTC (eg WBTC) gain momentum there is growing recognition that Bitcoin and Ethereum are more complementary than competitive
3. What is going on with the stock market, and what does it mean for crypto?
- US GDP shrank by nearly 5% in Q1 and over 30 million Americans have now filed unemployment claims in the last six weeks, but the S&P 500 index gained 13% on the month and is now only down 10% year-to-date.
- Amidst this environment, more and more evidence indicates that institutional and retail investors are looking to both gold and bitcoin as an alternative to buying stocks at present valuations.
- The third halving is coming soon in May, we looked into previous halving cycles. The hash rate has confirmed the rebound we announced in April, and is back to high levels of 2020.
- Confirmed transactions have slowly increased throughout the month of April; we dive into what it really means and look back at the recent drop in March.
- As the Bitcoin network became congested toward the end of April, we explain how mempool size and fees per transaction are related.
5. Key takeaways from bitcoin’s pre-halving price recovery
- Stablecoin activity can act as a proxy of risk-on/risk-off behavior in the cryptocurrency markets, and throughout the last few months we’ve seen daily active addresses increase for Tether
- There are some early pre-BTC halving signals of derivatives traders opening more short positions.
6. Why this halving will be different from previous halvings
- In 2020 we have a much broader array of market participants, larger market players, more established exchanges, and a far more developed derivatives market
- Miners are also relatively smaller market players now in 2020 than they were in the past
- Bottom line: the 2020 halving will likely have less price impact than the 2012 and 2016 halvings
Market movements: why Bonds and ETH are outperforming BTC in 2020
April was a strong month across most asset classes, with the notable exception of oil markets where West Texas Intermediate Crude Oil saw negative prices for the first time in history.
In April cryptoasset markets continued to bounce back from their “Black Thursday” March low for the year, with bitcoin in particular rallying strongly at the end of April. For the month (BTC) and Ethereum (ETH) gained 37% and 57%, respectively (Table 1). Bitcoin continues to easily eclipse all other major asset categories over the last twelve months, and US equities are the only asset class that is negative both YTD and over the last twelve months.
Table 1: Price Comparison (% Change): Bitcoin, Ethereum, Gold, US Equities, Long-dated US Treasuries, US Dollar

Sources: Blockchain.com, World Gold Council, Google Finance, MarketWatch
While bitcoin is outperforming gold for the year (+22% for the year vs gold +10%) it is slightly underperforming long-dated US Treasuries (TLT ETF +23% YTD). The bond market is benefiting from having a captive buyer (central banks) as well as favorable traditional factors that drive bond prices:
- economic growth outlook (poor)
- inflation outlook (disinflationary in the near-term)
- policy outlook (possible further rate cuts into negative territory in the US, etc.)
All crypto eyes on bitcoin’s halving
Bitcoin’s late-April price surge was likely driven by anticipation of the upcoming 12 May bitcoin “halving”, a once every four-year event where the reward for mining bitcoin is cut in half (thereby reducing the bitcoin supply growth rate). Bitcoin’s price has performed extraordinarily well in the months following the two previous halvings in 2012 and 2016 (Figure 1). However, analysis from CryptoCompare featured later in this newsletter outlines some important structural differences between today’s bitcoin market and the prior two halvings.
Figure 1: BTC price performance before/after mining reward “halvings”
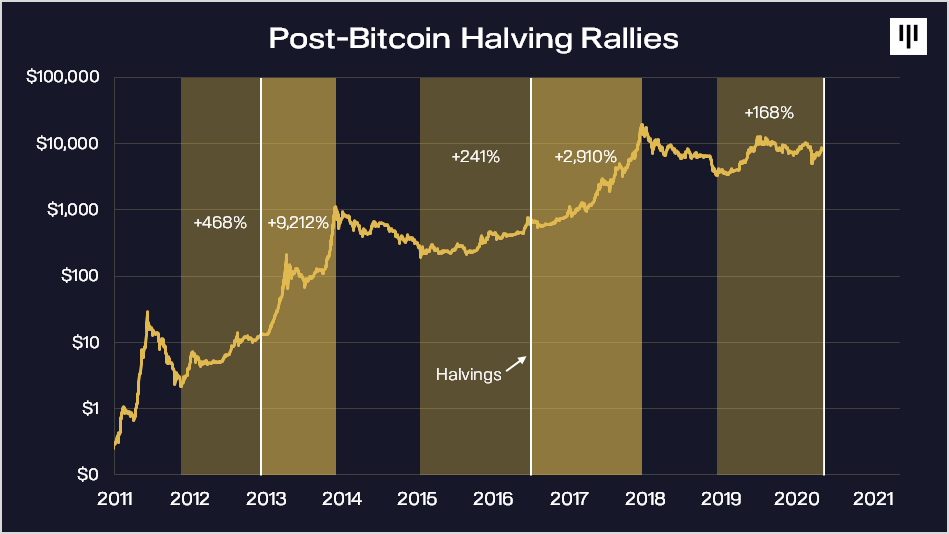
Whether or not crypto markets are showing some halving overexuberance will only be clear months after the cut in the mining reward. But over time, if current bitcoin demand levels are maintained (ceteris paribus) then the halving’s reduction in the rate of new supply may help boost bitcoin’s price.
Will Ethereum (ETH) continue to outperform bitcoin, or are improving fundamentals and Ethereum 2.0 priced in?
We reiterate the view expressed in last month’s newsletter that bitcoin (BTC) is the strongest cryptoasset to own in the current environment and it will continue to drive the overall price action in crypto.
Looking beyond bitcoin at other cryptoassets, one is reminded of the oft-cited expression that “in investing, the only free lunch is diversification”. Within the cryptoasset investing world should this advice also apply to “bitcoin maximalists”?
While not maximalists ourselves, we would highlight the importance of network effects (“Metcalfe’s Law”), or power law/winner take all (or most) dynamics that are often at play with technology platforms (eg social networks), currencies (US dollar as the world’s dominant reserve currency), protocols/standards (ethernet), and also blockchain networks.
Diversification also often means investors must spread their limited attention, and this can be particularly challenging in complex, less mature asset categories with high rates of change like cryptoassets. In other words, putting all your crypto “eggs” in just the bitcoin basket makes it easier to keep all the attention you can spare for crypto on that one basket.
There is an argument that Ethereum, the leading smart-contract platform, and Bitcoin, the most decentralized, secure and “hard” cryptoasset, are more complimentary than competitive.
Or at the risk of oversimplifying, bitcoin may hold more potential as a macro hedge and store of value, whereas Ethereum may hold more potential to serve as a relatively more useful medium of exchange.
Indeed, with all the various forms for “wrapped” BTC (eg WBTC) that are being tokenized atop Ethereum it is possible that Ethereum one day becomes the largest home for “Layer 2” bitcoin activity. How would that make bitcoin maximalists fond of criticizing Ethereum feel?
While there is endless debate in the cryptoverse over how deep Ethereum’s competitive “moat” truly is compared to Bitcoin’s, what is undeniable is that in 2020 the price of Ethereum (ETH) has significantly outperformed bitcoin (+64% vs. +22%).
Over the past 6–9 months Ethereum has shown fundamental improvements and strength in a number of areas, including significant growth in ERC-20 stablecoin use, a growing (albeit immature) DeFi ecosystem built atop Ethereum, and progress towards the long-awaited Ethereum 2.0 rollout. Ethereum’s forthcoming transition to a proof-of-stake consensus algorithm may also help suppress the available ETH supply (and thereby put upward pressure on the price of ETH).
Some of the recent exuberance for Ethereum may perhaps be reflected in the price premium observed in the Grayscale Ethereum Trust (ETHE), a traditional financial instrument with $270m in assets under management that is accessible to Wall St. institutional investors, retail brokerage and retirement accounts, etc. ETHE trust shares are currently trading at nearly a 5x premium to the underlying Ethereum (ETH) spot price (Table 1).
Table 2: Traditional Financial Investors are Paying ~5x Higher than Spot Prices to Gain Exposure to Ethereum (ETH)

How should the ETHE premium to spot be interpreted? The Grayscale Bitcoin Investment Trust (GBTC), which has over 10x assets under management of ETHE, also currently maintains a premium to bitcoin’s spot price, albeit a much lesser one at present (~17%). The lesser GBTC premium may be due in part to the greater range of ways traditional Wall St. institutions can gain exposure to bitcoin (eg CME futures, Fidelity, Bakkt, etc.). In other words, because bitcoin features far more ways for Wall St. to play than Ethereum at present there is a risk of lending too much weight to ETHE’s premium to spot in any Ethereum investment case.
Also countering somewhat the argument that cryptoasset investors should maintain at least some exposure to Etherum is the significant complexity (and risk) surrounding the Ethereum development roadmap (particularly the attempted transition to sharding). There is also significant uncertainty around the future of Ethereum’s monetary policy, as well as a significant number of well-funded competing smart contract platforms (so-called “Ethereum killers”).
Overall, holding ETH is probably riskier than holding BTC, but Ethereum is showing real fundamental progress of late and has had success fending off the many competitors seeking to dethrone the current king of smart contract platforms.

What is going on with the stock market, and what does it mean for crypto?
In April US equity markets had their best month since 1987 despite a continuing deterioration in economic fundamentals. US GDP shrank by nearly 5% in Q1 and over 30 million Americans have now filed unemployment claims in the last six weeks, but the S&P 500 index gained 13% on the month and is now only down 10% year-to-date. What gives?

Gillian Tett of the FT argues that the seeming incongruity between equity markets and the economic fundamentals is driven by central bank money printing and the markets confusing a liquidity problem for a solvency problem.
While Gilian may be correct that “many zombie companies will fail, no matter how much is sprayed around by the Fed”, it may also be true that the stock market will be ‘fine’ as overall performance is largely driven by a tiny handful of superstar stocks (~4% of listed companies).
In other words, current equity market valuations may not be crazy if every bankruptcy by a Hertz, J. Crew, etc. is more than offset by gains from stock market superstars like Amazon (if, in fact, Amazon continues to be a superstar).
But there are other explanations offered for why stocks rebounded so sharply in April.
New York Times columnist Paul Krugman recently reminded his readers of the three rules on the economic implications of the stock market:
“First, the stock market is not the economy. Second, the stock market is not the economy. Third, the stock market is not the economy.
That is, the relationship between stock performance — largely driven by the oscillation between greed and fear — and real economic growth has always been somewhere between loose and nonexistent.”
Krugman explains the recent performance of stocks as follows (emphasis ours):
“Investors are buying stocks in part because they have nowhere else to go. In fact, there’s a sense in which stocks are strong precisely because the economy as a whole is so weak. What, after all, is the main alternative to investing in stocks? Buying bonds. Yet these days bonds offer incredibly low returns.”
As is often the case with Krugman columns, this one contains multiple issues.
First, many people have been complaining about poor bond returns for years, but across multiple time dimensions (1, 3, 5 and 20-year time horizons) bonds have often outperformed stocks.
Now, surely with interest rates so low bonds can’t possibly continue to outperform stocks, right? Well, if US rates are driven by the Fed into negative territory to minus 3%, as former IMF chief economist Ken Rogoff argues will happen, and the Fed continues to support almost the entire US credit market with infinite quantitative easing, then bonds may still have significantly more upside from today’s prices.
The other issue with Krugman’s suggestion that investors have nowhere else to go than stocks is that Krugman is (in)famously anti-gold and anti-bitcoin. Krugman, likely for political reasons, does not point to the yellow metal or crypto as legitimate investment alternatives to the stock market.
However, more and more evidence indicates that institutional and retail investors are looking to both gold and bitcoin as an alternative to buying stocks at present valuations. But don’t hold your breath for Krugman to tip you off to that fact.
Changing attitudes amongst traditional investors that have favored stocks is important as strong equity market performance in recent years has often been cited as a reason why traditional investors have not felt the need to allocate funds to crypto. We also believe gold, which traditionally has also often struggled to attract institutional capital, can help pave the way for allocations into crypto. Indeed, “digital gold” and traditional gold share a lot in common, but our view is that bitcoin offers much more upside (and volatility) than gold. In eight of the last 10 years bitcoin has been the #1 performing asset (Table 2).
Table 3: Bitcoin has outperformed all traditional assets classes in eight of the last ten years and is on track to outperform again in 2020

Pre-halving hashrate has rebounded to near all-time highs and why there are more on-chain transactions than it seems at first glance
Halving Cycles
The next halving is coming on 12 May at block height 630,000. Historically, the price of bitcoin has performed extremely well following the two prior halvings of the mining reward (Figure 2).
Figure 2: BTC price performance before/after mining reward “halvings”
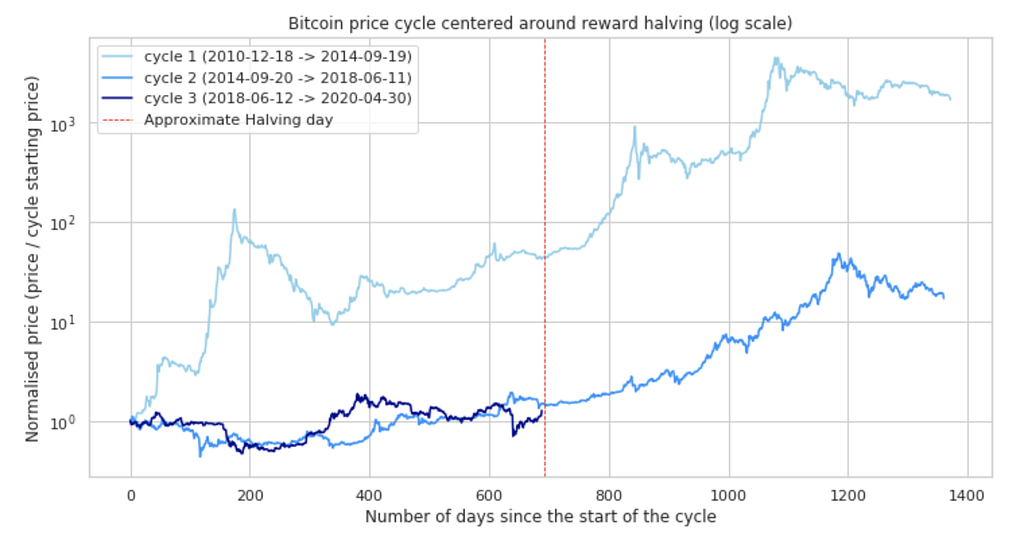
In the meantime, bitcoin’s hash rate has confirmed the rebound we described in April, and is poised to make a new all-time high. Hash rate will be a key metric to follow post-halving, with the mining becoming less profitable, to understand what impact the reward cut has had on the percentage of miners that can no longer operate profitably.
Number of confirmed transactions per day
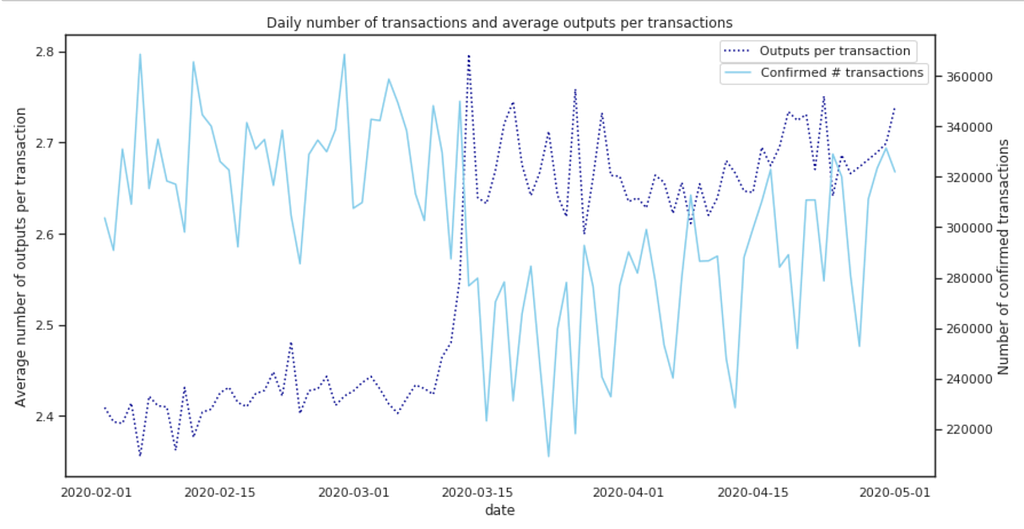
While the Covid-19 crisis likely played a part in the sudden 20% drop of daily confirmed transactions in March, we found that the average number of transaction outputs (recipients) per transaction increased suddenly at the exact same time. This is a sign that one or multiple entities, including Coinbase, updated their infrastructure to start batching transactions. Batching transactions is the process of grouping single transactions into a single big transaction by combining inputs and outputs. It has the benefit of reducing the total size it occupies on the blockchain, resulting in discounted fees for senders. This is a good example of how only looking at the number of confirmed transactions could be a misleading indicator: such batching, despite showing a decrease in the count of transactions, is beneficial for the health of the network and does not change how many people transact in the network.
In April, the number of transactions resumed its positive trend.
Figure 3: Daily number of BTC transactions and average outputs per transaction
How mempool size and fees per transaction are related
The mempool is where all the valid transactions wait to be confirmed by the Bitcoin network. A high mempool size indicates more network traffic which will result in longer average confirmation time and higher priority fees. The mempool size is a good metric to estimate how long the congestion will last whereas the Mempool Transaction Count chart tells us how many transactions are causing the congestion.
April has seen two examples of the impact of the network congestion on the transactions fees. While the daily average fee per transaction remained below $0.63 in the first part of April, a first surge in the traffic on the 23rd of April increased the fees to $0.92.
Increased price volatility in the market drove a sudden second increase in fees per transaction to $2.94 per transaction at the end of April.
The way that our Blockchain.com Wallet addresses big network fee movements is to use dynamic fees, meaning that the wallet will calculate the appropriate fee for a transaction taking into account current network conditions and transaction size. Customers then have the option to select a ‘Priority fee’ to get a transaction included in a block within the hour or to select a ‘Regular fee’ for those who can be more patient and wait for optimal fees.

Key takeaways from bitcoin’s pre-halving price recovery
A guest feature by Into the Block
Bitcoin price has more than doubled from its March lows, with the narrative changing from coronavirus panic to optimism towards the upcoming block reward halving. While this led to bullish momentum and price growth throughout April, some early signs of a potential reversal have been developing on the derivatives market and onchain activity for Tether.
IntoTheBlock’s Historical In/Out of the Money tracks unrealized gains and losses for Bitcoin addresses’ positions. Comparing unrealized gains at different points in time with a similar price range is a useful way to track how market positioning and sentiment is changing. For example, comparing unrealized gains before and after the March crash for Bitcoin shows us that addresses accumulated at lower prices during March and April, gaining bullish momentum with addresses in the money increasing from 20.57 million to 23.04 million in less than two months. Addresses also realized losses during the crash as can be seen from the decrease in addresses out of the money from 7.35 million to 6.07 million despite price being at a similar range. In short, blockchain data shows that a significant amount of Bitcoin addresses losing money realized their losses, while new addresses bought at lower prices throughout the recent rally back up to pre-Black Thursday levels.

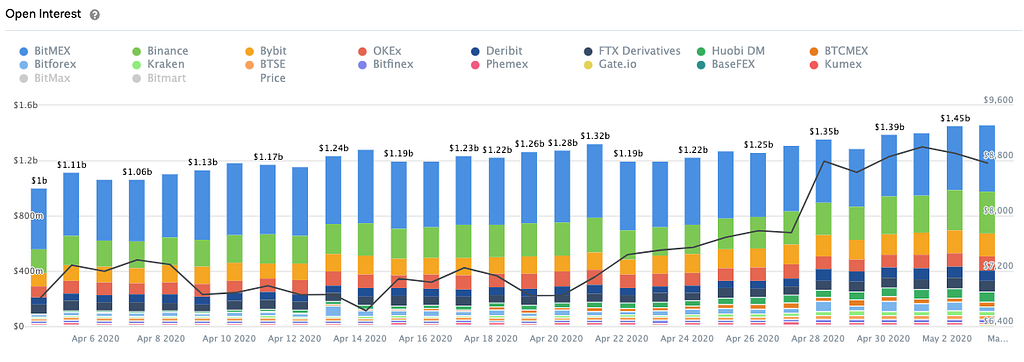
Open positions in the Bitcoin perpetual swaps market also increased throughout the recent rally. Generally, increasing open interest along with increasing price is a bullish sign indicating trend strength. However, after surpassing the $9,000 mark price has declined slightly while open interest continued increasing. This could be an early signal of derivatives traders opening more short positions.
Stablecoin activity can act as a proxy of risk-on/risk-off behavior in the cryptocurrency markets. In particular, stablecoin’s address activity, transactions and balances can act as a gauge of market positioning and perceived risk. Similar to traditional markets, cryptocurrency traders’ allocation to cash or cash-equivalents tends to increase prior to and during market downturns. Fortunately, blockchain’s transparent nature allows us to examine this activity closely.
Throughout the last few months, we’ve seen daily active addresses increase for Tether, hitting 80,000 addresses for the first time on March 13 (when Bitcoin bottomed) and surpassing the 100,000 milestone on April 30. Zero balance addressees, or addresses that transferred out all of their tokens either to purchase another token or to send to another address, have moved sideways for the most part during these months. In the graph below, we can see zero balance addresses increasing during the March 13 bottom, but not in late April, pointing to the possibility of Tether addresses adding to their positions rather than transferring out their tokens. At the same time, new Tether addresses created hit year-to-date highs in late April, pointing to an increasing interest in cash allocations in the crypto markets.

Furthermore, the increasing average balance of Tether addresses supports this trend towards stablecoins positioning despite the price rally as can be seen below.
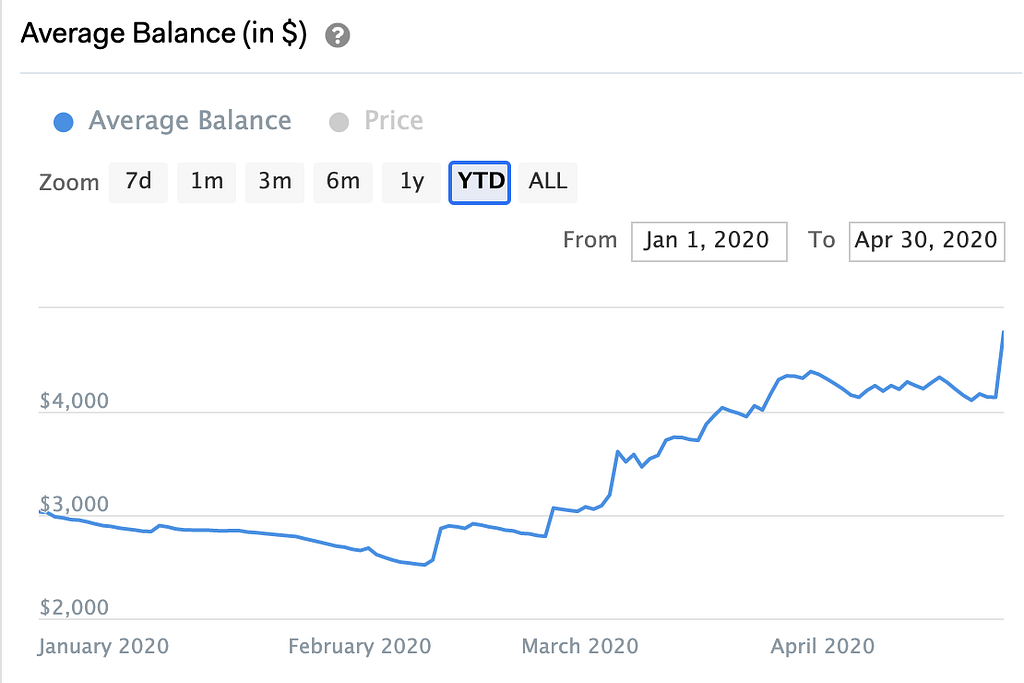
Bitcoin recovered quickly from the Black Thursday panic as headlines quickly shifted to the halving. With the halving being only a few days away, investors seem to be preparing their positions to a risk-off scenario where price may drop following this anticipated event.
Why this Halving will be different from previous Halvings
A guest feature by CryptoCompare
With the Bitcoin halving now a few days away, we thought we’d share with you some data-driven insights into what we think may happen this halving cycle.
Key Takeaways:
- The data shows that the market is very different from previous halvings — and the impact of miners selling their bitcoins is very different this time around.
- The options market suggests that we will not see a bullish period in the months following the halving.
- The impact of Covid-19 so close to the halving and Bitcoin’s correlation to equity markets means we may not see significant surges in price.
The countdown to the halving
Bitcoin is set to reduce its block reward by half around May 12th and Google searches for “Bitcoin halving” are skyrocketing. What is particularly significant about this halving cycle is its timing. With bitcoin set to reduce its rate of supply at the time that central banks around the world are conducting one of the greatest money supply experiments in history, many eyes are turning to the nascent digital asset as a hard, digital store of value.
The case for a price surge
Previous halvings have heralded significant surges in the Bitcoin price around the halving event and in the months following. Why did this happen? Will it happen again?
Simple economics would dictate that if there is a decreasing rate of supply of an asset and demand remains the same or increases, then all things being equal, the price of the asset will go up.
What’s more, many Bitcoin proponents, point to a model known as Stock to Flow, to argue in favour of dramatic price rises around halving events and with Bitcoin’s ratio set to increase with a decrease in supply, they are expecting a surge in price following the halving.
But history does not always repeat itself, and a far larger, more established crypto market may not produce the same results in 2020.
What does the data say?
The market in 2020 is very different from 2016.

In 2016, the total daily Bitcoin volume on spot exchanges rarely exceeded $1 billion USD, peaking at close to $1.5bn roughly 2 weeks before the halving. In 2020, in contrast, total daily volumes in 2020 are regularly ten times this number, with daily spot volumes on Top-Tier exchanges hitting $21.6 bn on March 13th.
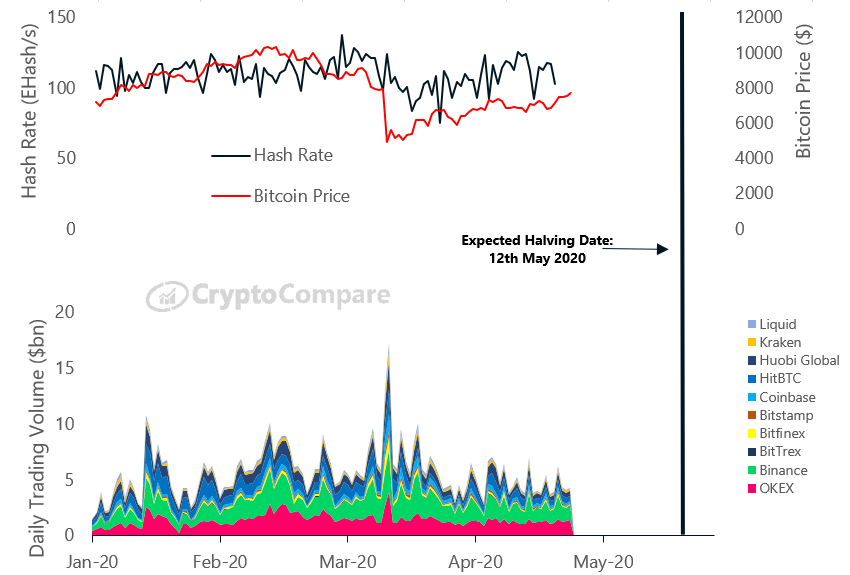
Furthermore, it is crucial to acknowledge that in 2020 we have a much broader array of market participants, larger market players, more established exchanges and a far more developed derivatives market.
All of this means that we may see less of a price increase in the year following the halving.
Miners are smaller players in 2020
During previous halving cycles, miner selling was a bigger determinant of the sell pressure in bitcoin markets. In 2016, miners likely had a far bigger impact on the bitcoin price, as miners selling their bitcoins represented a larger and more impactful component of bitcoin sell pressure.
Some have argued that this halving of sell pressure contributed to the rise in bitcoin price in the months after the halving event in 2016 and 2017.
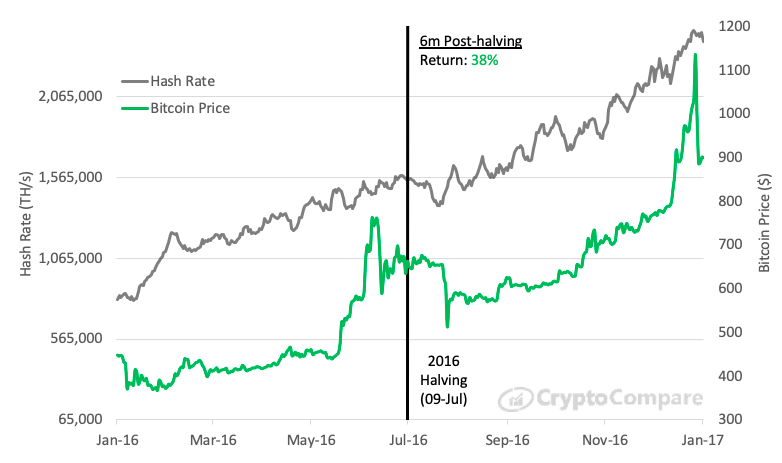
Now however, with far higher spot and derivatives volumes, and more market participants, the drop in sell pressure from miners selling half the number of bitcoins will have less of an impact on the total sell pressure. We might therefore expect less of an impact in the months following this year’s May halving, and therefore less of a surge in price.
Options: the market does not expect a surge
Options market makers are often considered the most knowledgeable market participants, and many look to their pricing for indicators of where prices are heading. The more mature derivatives market of 2020 gives us a better picture than in 2016 of what the market thinks. Specifically, the bitcoin options market gives us some insight into what the market believes will happen.
Implied volatility is a derived metric which measures the expected volatility of an asset, and is used by traders to gauge the forward-looking sentiment of a market: higher implied volatility is associated with higher premiums for options, meaning there is greater demand for those options.
If we look at the skew today of the implied volatility for bitcoin options we can see that the market is more concerned about the downside of bitcoin dropping in price, than the potential upside.

Looking at the chart above for Deribit, we can see that the curve to the left is far steeper than the curve to the right. What this means is that sellers of options (such as market makers) at these lower strike prices on the left are commanding higher premiums for these options, as they believe there is more downside risk to the bitcoin price, and buyers of options at these low strike prices are more willing to pay a premium to express their views, as they also believe there are more downside movements to come.
In short, the options market does not expect the bitcoin price to rise much, and is more concerned about the price dropping. This also currently holds for contracts expiring in June, September and even December.
While it’s possible that this chart just points to a risk-averse options market, (particularly if it primarily comprises miners who are already long bitcoin through mining), it does add weight to the argument that markets are not expecting much of a price surge in the aftermath of the upcoming Bitcoin halving.
The elephant in the room: Covid-19 and Bitcoin’s ‘Black Thursday’
Finally, we cannot ignore the impact of Covid-19 and the massive effect it has had on financial markets. With crypto markets by and large tracking equities throughout the financial turmoil of recent months, bitcoin saw one of its biggest single day drops on March 12–13th, plunging over 40% to trade below $4,000 on some venues, as stock markets took a beating.
Comparisons with previous halving cycles therefore, cannot ignore the impact of enormous macro events like the coronavirus crisis, the fact that bitcoin now seems to track equities quite closely, and that such dramatic external shocks to the bitcoin price so close to the halving may negate much of the supposed impact of these events.
What does this all mean?
Predicting the bitcoin price is notoriously difficult. While in theory a decreasing supply, and stock-to-flow models may suggest a surge in price, the reality is a lot more complicated. A far larger, broader spot and derivatives market means that miner selling is simply less impactful. Options markets do not point to a bullish period following the halving, and the impact of Covid-19 and equity market volatility on the Bitcoin price could suppress the bitcoin price.
What we’re reading
Crypto-focussed
- BitMEX Research: Ethereum 2.0 + Who Funds Bitcoin Development
- Financial Times: A16z raising $450M for new crypto fund
- Bitwise: Why Facebook’s Libra is a bigger deal than you think
- Krebs on Security: Europe’s Largest Private Hospital Operator Fresenius Hit by Ransomware
- Coin Desk: Is crypto becoming more competitive or consolidated?
Beyond crypto
- National currencies under significant pressure in Turkey, Lebanon, etc.
- Ken Rogoff (Project Syndicate): The Case for Deeply Negative Interest Rates
- Willem H. Buiter (Project Syndicate): The Problem With MMT
- Pomp Podcast: Peter Zeihan Explains The Geopolitical Landscape
- The Coming War on China
For more insights from our research team, go to our Research page and follow our Head of Research, Garrick Hileman on Twitter.
May Market Outlook was originally published in @blockchain on Medium, where people are continuing the conversation by highlighting and responding to this story.


