DeFi-ing Gravity

September Market Outlook
Crypto solves problems.
For over a decade cryptocurrencies and blockchain networks like bitcoin and ethereum have offered 10x improvements (or more) over the status quo, including:
- predictable and limited monetary policy (bitcoin is the world’s hardest asset)
- global crowdfunding
- low cost and speedy cross-border payments
Solving problems is the simple explanation behind why crypto continues to grow in use and value.
The latest problem crypto is addressing is financial repression (also known as “yield curve control”), a shrouded mix of economic policies that can help manage unsustainable government debts through manipulating interest rates to artificially low levels.
Thankfully, crypto offers a solution to the ongoing liquidation of traditional savers in the form of the nascent crypto interest markets.
Crypto lending markets currently offer double-digit interest on US dollar stablecoin deposits and sometimes even greater yields (and risks) via various DeFi (decentralized finance) protocols, as we discussed on our latest webinar with Anthony Sassono. Both the crypto industry and its users stand to be one of the big if not biggest winners from financial repression.
Summary
1. August Markets: Ethereum and the DeFi ecosystem continued to significantly outperform other asset categories while long-dated US Treasuries plummeted and the US dollar continued to slide
- For the month Bitcoin (BTC) was up 3% in August and outperformed gold, which was flat, but trailed equities with the S&P 500 +7%
- Ethereum (ETH) continued to be the standout performer amongst major cryptos and was +22% in August, driven by strong DeFi activity; ETH continues to lag slightly behind bitcoin over the past two years
- After dropping 4% in July the US dollar continued its slide, down 2% in August
- Possibly signaling heightened concern over financial repression, long-dated US Treasuries (TLT) were a big loser in August at -5%
2. On-chain insights: highlights from the Blockchain.com data science team
- Bitcoin market capitalisation is up 3% despite a decrease in network activity.
- Japan is in our top 10 trending countries for the third time in a row. On the other side, Belarus has seen a decline of 50% of activity in comparison to other countries since April.
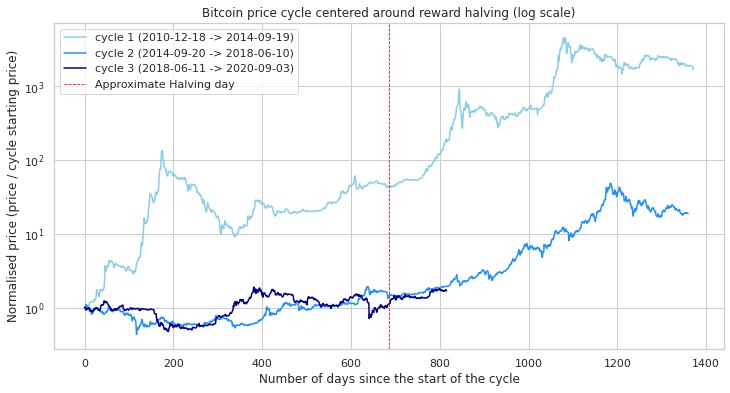
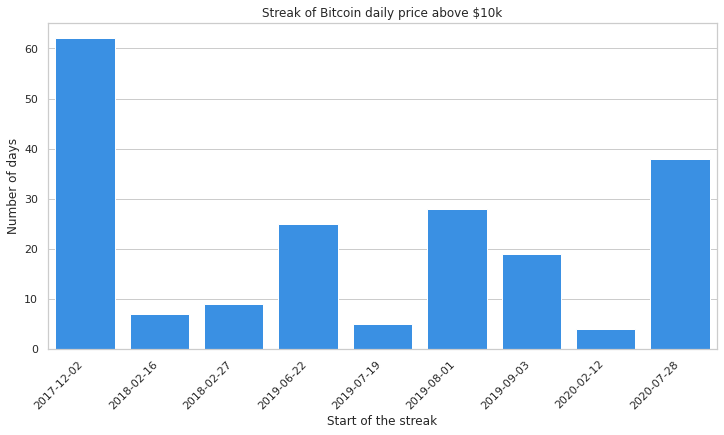
- Bitcoin Price on track for potential gains in the second half of the halving cycle, and is currently on its second longest steak above $10k
3. Insights Behind the Growth of Tokenized Bitcoin (BTC) on Ethereum (ETH)
- Tokenized Bitcoin locked on Ethereum has reached $800 million, or roughly 0.38% of the circulating supply
- Tokenized BTC growth has largely been driven by whales and institutional investors
- Average balance of a wBTC and renBTC holder reaching $95,000 and $217,000 respectively
4. What we’re reading, hearing, watching
1. Ethereum and DeFi continue soaring in August as long-dated US Treasuries plummeted and the US dollar’s slide worsened
DeFi mania continued this past month with Ethereum posting back-to-back 20%+ monthly gains, up 22% in August.
Bitcoin (BTC) had another positive month (+3%) and outperformed gold (+0%), but lagged behind equities (S&P 500 +7%). Stocks were once again driven by a red-hot tech sector, led by companies such as Tesla (TSLA) +74% and Apple (AAPL) +22%, which became the world’s first company to achieve a $2 trillion market capitalization.
Two of the big losers in the month of August were the US dollar (-2%) and long-dated US Treasuries (-5%) (Table 1). As we discussed last month, a weakening in traditional safe havens like the US dollar and Treasuries is bullish for crypto, particularly bitcoin.
Table 1: Price Comparison: Bitcoin, Ethereum, Gold, US Equities, Long-dated US Treasuries, US Dollar (% Change)

One of our main themes is Wall Street and crypto convergence. However, while stocks (and tech stocks in particular) have remained on a tear there is less motivation for institutional investors to consider allocating to crypto.
As concern over record-high equity valuations grows, along with growing antitrust interest in Big Tech, we anticipate that more traditional institutional capital will begin to take a closer look at cryptoassets. The entire market value of cryptoassets today stands at ~$380 billion, or just 17% of the total market value of one company, Apple (AAPL).
Ethereum and DeFi boom continues while rising warnings over a 2017-ICO style bubble grow
Last month we warned about possible excessive leverage and over exuberance in DeFi, and these warnings have since been echoed by other crypto industry leaders (1, 2, 3). Traditionally, markets that inflate rapidly often experience a painful unwind, especially when that rise is powered by significant leverage. Crypto has never been immune to this phenomenon.
As we are about to publish here on September 2nd we are seeing a significant pullback in some highflying DeFi tokens, with DeFi darling yearn.finance (YFI), which was up an astonishing 750x from July, down ~20% in the last 24-hours.
For investors interested in gaining exposure to DeFi we reiterate our comments from last month:
There is undoubtedly real innovation underpinning many of the leading DeFi platforms, and we’ll be publishing more on this exciting area of crypto in the months ahead. Investors should be aware that picking individual DeFi winners from the losers investors can be difficult given how rapidly DeFi is evolving. However, Ethereum (ETH) is a way to gain broad exposure to the DeFi boom, as growth in the use of DeFi and other applications built atop the Ethereum protocol (eg stablecoins) appear to be helping to drive a growth in the value of ETH.
2. On-Chain Analysis
Each month we dive into on-chain data to explore interesting trends or movements on the Bitcoin network.
We start at a high level with a look at network activity in August compared to July (Table 2).
Table 2: Bitcoin network activity — August vs July

The average fee per transaction in August was $3.97 per transaction as compared to $2.43 in July.
Trending countries⁴
Another question we’re often curious about is how crypto usage is trending at the country level. In August, among our top trending countries this month, Czech Republic, Brazil and Morocco are mainly returning to their previous level of activity after being less active in the last couple of months. On the other hand, Japan is once again in the top 10 and its activity has increased by 50% since April. Despite a relatively small activity compared to other countries, Ecuador’s activity is increasing month after month (Table 3).
Table 3: Trending countries: increase in use in August over July

Meanwhile, Benin, Indonesia and Thailand are the top 3 decreasing countries this month (Figure 4). Belarus, in 4th place, has lost 50% of market share in comparison to other countries since April.
Table 4: Trending countries — decrease in use in August over July

Bitcoin ownership concentration
Bitcoin ownership distribution, as measured by the number of unique addresses owning a material quantity of bitcoin, continued to expand. The number of addresses holding at least 0.1 BTC was up +0.7% over June and addresses holding at least 1 BTC increased by 0.38% over July⁵:
- 3,101,745 addresses (10.0% of total addresses) have more than 0.1 BTC, and represent 98.87 % of total bitcoins
- 818,416 addresses (2.64% of total addresses) have more than 1 BTC, and represent 94.97 % of total bitcoins
Bitcoin Price on track for potential gains in the second half of the halving cycle
On the 11th May, the entire bitcoin community had their eyes turned on the halving that occurs roughly every 4 years. Almost 4 months have passed and Bitcoin is still looking strong. The hash rate has reached all-time high with the estimated mining power of 129 exahash per second (EH/s) in August.

Bitcoin Price held its second longest steak above $10k

3. Insights Behind the Growth of Tokenized Bitcoin on Ethereum — Guest Post by Into the Block
Tokenized versions of Bitcoin on Ethereum have grown remarkably throughout 2020. These ERC-20s are pegged 1:1 to the price of BTC being backed by the equivalent amount of Bitcoin. The first recognized Bitcoin ERC-20 to launch was Wrapped Bitcoin (wBTC), which was released in January 2019.
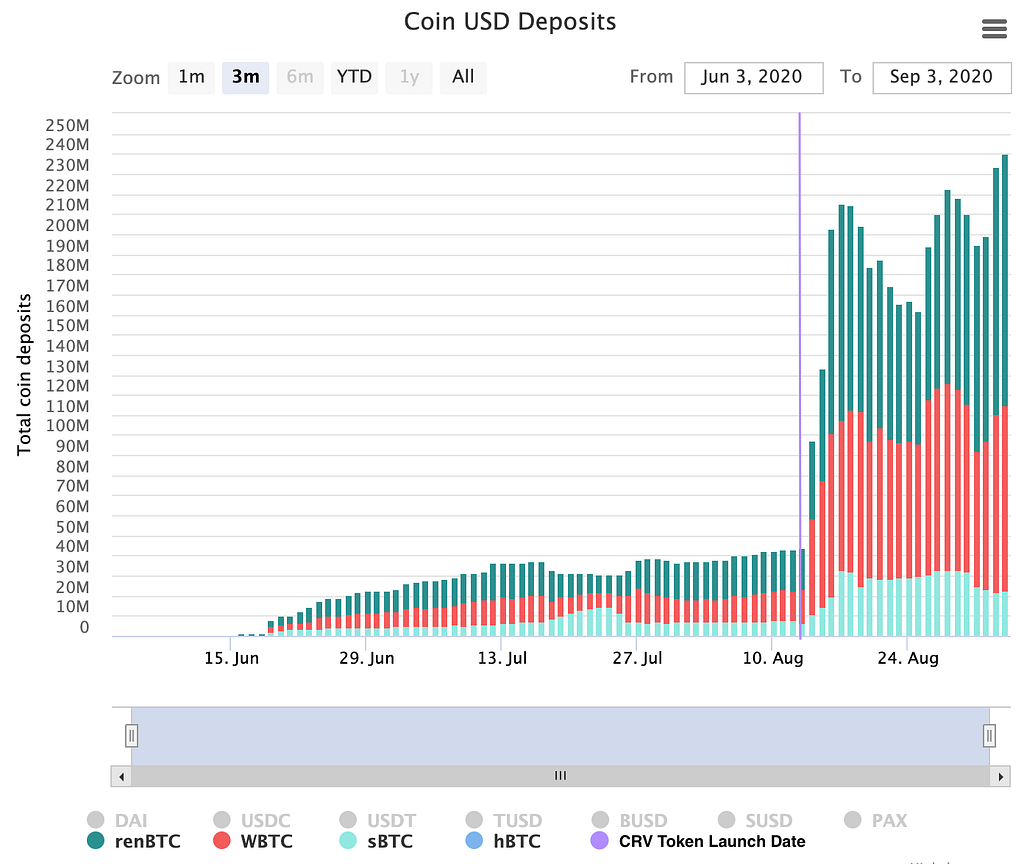
At the beginning of 2020, the market capitalization of wBTC was still under $5 million. The low adoption seen during its first year was likely due to the lack of integrations and functionality wBTC, offering no clear benefit over standard Bitcoin at the time. This started to change as DeFi protocols integrated Bitcoin ERC-20s and provided services users on top of it. Specifically, being able to earn compound interest on top of it through protocols like Curve led to wBTC’s market cap surpassing $430 million by September. This growth accelerated following the release of the CRV token as shown below:

This is particularly impressive when considering that tokenized Bitcoin deposits grew at a faster rate than stablecoins deposited to Curve. As a result of this and other similar incentives, the amount of tokenized Bitcoin locked on Ethereum has reached $800 million, or roughly 0.38% of the circulating supply.
Institutional Investors are Leading the Adoption of Tokenized Bitcoin
By analyzing key on-chain metrics from IntoTheBlock, we can determine that the growth in tokenized Bitcoin has largely been driven by whales and institutional investors. This is reflected in the average balance of a wBTC and renBTC holder reaching $95,000 and $217,000 respectively.

The adoption by large players may come as no surprise given the high gas fees users have to incur to tokenize their Bitcoin and deposit into DeFi protocols. Partly because of this, the total number of addresses holding these tokens has not grown as significantly, with only 4,700 and 800 addresses holding wBTC and renBTC respectively. Another potential reason is that aside from early adopters, average retail users in general take longer to trust and learn how to use these yield-generating Bitcoin alternatives.
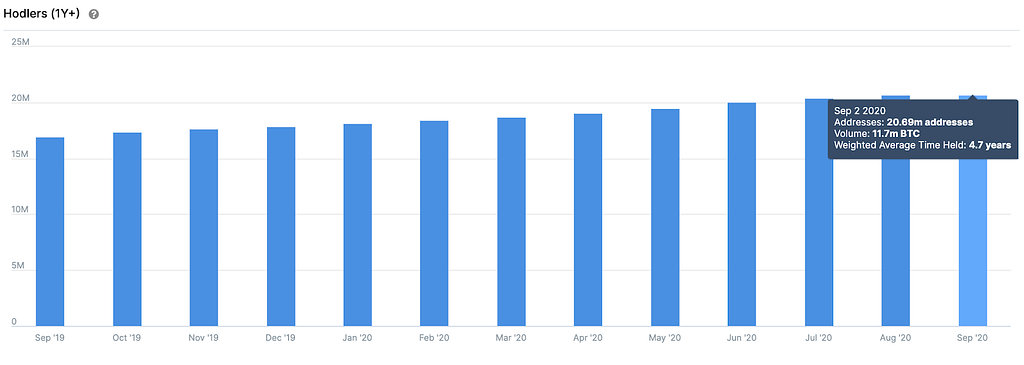
With the crypto space increasingly shifting its focus into high yield opportunities, it is likely that a significant percentage of Bitcoin hodlers will join the trend. By looking at IntoTheBlock’s Hodlers indicator, we can observe that 20.69 million addresses have been holding a total of 11.7 million Bitcoin for over one year. Most of these are unlikely to be earning on their positions as interest-bearing DeFi and CeFi solutions are still relatively new.

This indicates that nearly two thirds of all Bitcoin holders and of the circulating supply have not moved in over a year. With DeFi protocols providing useful ways for holders to leverage their BTC holdings, it is probable that more long-term holders opt to transfer their Bitcoin onto Ethereum.
In regards to the effects this is expected to have on Bitcoin, being able to utilize BTC for financial services like loans or to earn interest is likely to drive demand as its potential is expanded beyond investing and trading activities. Additionally, locking tokenized Bitcoin in smart contracts should in theory decrease the supply of underlying Bitcoin available to be sold.
For Ethereum, bringing in Bitcoin’s liquidity is expected to make DeFi protocols built on top of it more robust, attracting more users to the Ethereum blockchain. The only issue would be its impact on its already high gas fees and congested network. Overall, though, as scalability solutions get implemented, adoption of Bitcoin on Ethereum should continue to expand and the top two cryptocurrencies stand to benefit from this trend.
4. What we’re reading, hearing, watching
Crypto
- A Global Look at Central Bank Digital Currencies
- Longtime Analyst Bove Says Cryptocurrency is One Challenge to Dollar’s Dominance
- Why DeFi Pulse’s Key Metric Is So Simple It’s Confusion
- We’re at the Early Stages of a Truly Novel Structure That Can Organize Humans and Money
- Exploring The Design Space of Liquidity Mining
- 2020 Market Data Integrity Report
Beyond crypto
- The Panopticon Is Already Here
- The Pandemic Depression; The Global Economy Will Never Be the Same
- Financial Repression Revisited?
- Africa’s Gathering Debt Strom
Important note
The research provided herein is for your general information and use and is not intended to address your particular requirements.
In particular, the information does not constitute any form of advice or recommendation by Blockchain.com and is not intended to be relied upon by users in making (or refraining from making) any investment decisions.
Appropriate independent advice should be obtained before making any such decision.
Footnotes:
- Average daily number of confirmed transactions in the public blockchain
- Average daily number of confirmed transactions sent from our Blockchain Wallet and API
- Average daily number of unique addresses used as inputs and outputs in the confirmed transactions
- Based on a subset of our wallet users. The top 10 excludes countries with fewer than 0.3% of total number of transactions
- Source: https://bitinfocharts.com/top-100-richest-bitcoin-addresses.html
DeFi-ing Gravity was originally published in @blockchain on Medium, where people are continuing the conversation by highlighting and responding to this story.


